
IN an opinion piece entitled ‘Our hot, dry future’ published by Melbourne’s The Age newspaper on October 6, 2008, Dr David Jones, head of climate analysis at the Australian Bureau of Meteorology, suggested global warming was responsible for the current long drought in Melbourne and that there was worse to come.
I don’t think the article was very convincing. I am annoyed that it didn’t include any real data. While Dr Jones claimed that “We know that over the past 11 years Melbourne's rainfall has been about 20% below the long-term average”, he didn’t explain what period this “long-term average” covers and what is the relevance of the last 11 years given it is accepted that over this period there has been a dominance of El Nino, and therefore dry conditions.
Key Australian Institutions have claimed for some time that we have a water crisis because of climate change.
Indeed in 2005 CSIRO published a "Melbourne Water Climate Change Study" claiming "...the greater Melbourne Region has had its lowest rainfall on record compared to all other periods of similar length.”
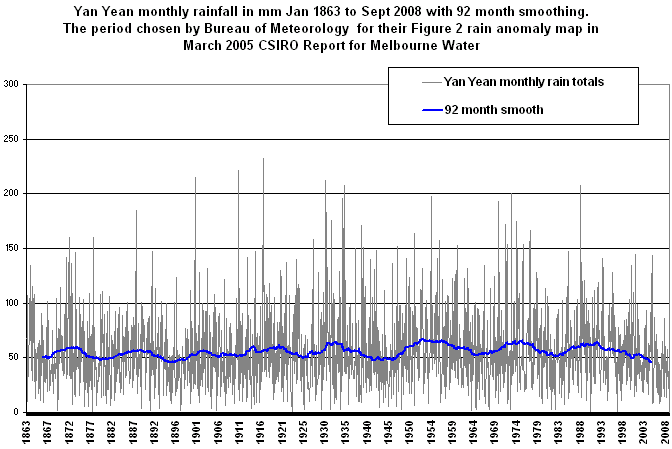
But as blogger, Warwick Hughes, showed some time ago, the period chosen was just 92 months, from October 1996 to May 2004.
In order to put their statement in some context Mr Hughes graphed high quality rainfall data for the weather station closest to Melbourne, Yan Yean, back to January 1863 – and he has just updated the chart to the end of September 2008.

A high quality version of this chart can be found at Mr Hughes' website, click here.
The chart indicates that Melbourne experiences dry periods every so often and that the current drought is similar in magnitude to the droughts of 1896, 1925 and 1945. The chart showing 145 years of data, does not support the claim, made by Dr Jones in his article in Melbourne’s The Age, that there has been recent unusual climate change in Melbourne. Indeed periods of drought and flood are a natural hazard.
*************************************
Read Part 1 here:
https://climatelab.com.au/blog/2008/10/how-melbourne%e2%80%99s-climate-has-changed-a-reply-to-dr-david-jones-part-2/
Read Part 2 here:
https://climatelab.com.au/blog/2008/10/how-melbourne%e2%80%99s-climate-has-changed-a-reply-to-dr-david-jones-part-1/


[...] Part 3 of this series, https://climatelab.com.au/blog/2008/10/how-melbourne%e2%80%99s-climate-has-changed-a-reply-to-dr-d... [...]
Louis - this is not about models - but obs.
Cloud seeding - LOL - who says it even worked on anything but small local scales? Surely you're not suggesting Louis that the HUMAN RACE with teensy weensy amounts of substances could affect the weather (choke choke - no inconsistency here).
And even more recent - updated just 10/10/08 http://www.bom.gov.au/climate/current/statements/scs16.pdf
Fancy putting up a bloody moving average to deliberately take one's eye away from the end of the graph - the actual issue in question - thanks Warwick.
Inappropriate statistic for the issue.
And cherry picking one station ! when the run of years sequence for the catchment on multi-year percentiles/deciles is worst on record. 7 and 12 year sequences. The only caveat would be that the analysis period runs from 1900.
What is clear is that we don't really understand the weather - but that does not stop the ignorati from trying to model it. After all, what would a mathematician or computer programmer need to know about geophysics?
What seems to be lacking in this thread is the fact that CSIRO were cloud seeding as pointed out by Warwick Hughes - and on stopping that project, rainfall has returned to its previous levels.
Er, I meant "M. Wild et al" (not "et Al"), lol.
Climate models all say that with warming, there is more rain. And indeed, precipitations on continents have increased of 3.5mm per year during the 1986-2000 period (M. Wild et Al GRL 2008).
So, should models be trusted, the decrease in rain for Melbourne is due to global cooling!
One way or another, the warmist crowd is doomed by climate.
Although I went searching for MMBW records for Yan Yean, Silvan, Upper Yarra etc imo it’s a bit of a cherry pick to see only one rainfall chart held up for this discussion as interesting at it may be.
On the ABC program Gardening Australia this evening, Jane Edmanson from Melbourne introduced a tour through the old Fitzroy Gardens and their recent modifications to cope with extended drought.
http://www.abc.net.au/gardening/stories/s2400070.htm
Because this place contains some of the oldest trees round that fair city I have been following the news on the impact of water restrictions there for some time. What we don’t have here for a comparison is the rainfall records for the inner city where most people suffering local drought live, work and play.
Today I asked a landscape gardener staying at his old home in Canberra if he believed we were suffering too and how did he know etc so we got a very interesting reply. “You can see it in the land he said” and he rattled on about the various signs. The big surprise though was the fact he is only visiting since all his work now is in San Francisco.
I guess they must have similar drought problems too.
Reference being. http://www.bom.gov.au/climate/current/statements/scs14.pdf
Come on Jen - this is weak as water. (or lack of). How about some spatial catchment analysis. Sheesh ! You wouldn't let an old BoM basher like Warwick to audit your shopping list. Fancy picking Ying Yong - he might as well have picked Frankston.
Have a look at figures 1 and 3. And this is even before a runoff analysis ...
Lordy me...
Of course you might well ask why the El Nino frequency has been high, why the Walker circulation has karked, why the STR does what is does and what SAMy seal has been up to - but hey - why think about things when you can pick a single cherry at Yo Yo.
The graph certainly shows the second 70 year period had much more rainfall than the period from 1863 to 1934.
So we can definitely say that Melbourne has been getting more rainfall from 1935 to 2008 and had an 8 year period from 1985 to 2000 that was heavier( year on year) than the period 1863 to 1915 (52 years)
So after we hopefully have a sustained cool phase PDO ( carbon copy of 1946 to 1977 would be nice) the more frequent la ninas should return our rainfall up to the normal higher levels.
We can be thankful that we don't have to endure that exceptionally dry period from 1863 that lasted half a century.
What were the co2 levels then I wonder?